Match tables with different taxon names
rOpenSci package: taxize
A common situation when a set of species is having more than one table of data, each with taxonomic names. These tables need to be merged at some point.
The problem is that some of the names in the separate tables may actually be the same, but one table may have updated names while the other may have old names. Therefore, when merging, two rows of data that should be matched are not.
We can easily take care of this problem using taxize.
Install taxize from CRAN
install.packages("taxize")
Load taxize
library("taxize")
Table 1
df1 <- data.frame(species = c("Helianthus annuus", "Silene acaulis", "Mimulus alpinus","Phlox drummondii", "Triteleia hyacinthina"), var1 = rnorm(5), var2 = rnorm(5),stringsAsFactors = FALSE)
Table 2
df2 <- data.frame(species = c("Helianthus annuus texanus", "Cucubalus acaulis","Mimulus langsdorffii alpinus", "Armeria drummondii", "Triteleia hyocinthina"),var3 = rnorm(5), var4 = rnorm(5), stringsAsFactors = FALSE)
Take a look.
df1

                species    var1    var2
1     Helianthus annuus  0.7285 -0.4922
2        Silene acaulis -0.6368  0.1510
3       Mimulus alpinus  0.1223 -0.2955
4      Phlox drummondii -0.1071 -0.6371
5 Triteleia hyacinthina  3.0563  2.3601

df2

                       species    var3    var4
1    Helianthus annuus texanus  1.2547  1.5582
2            Cucubalus acaulis  0.1917 -0.4014
3 Mimulus langsdorffii alpinus -0.7310  0.3817
4           Armeria drummondii -0.8728 -1.8467
5        Triteleia hyocinthina  2.1583  0.5587
Get the up to date accepted names for both tables
And add that as a new column to each table. In this example I’m using
the tpl_search function which searches the Plantlist.org, but you can
use other functions for the Taxonomic Name Resolution Service (TNRS),
NCBI, EOL, and more.
(df1_corr <- tpl_search(as.character(df1$species), corr = TRUE))

       Genus     Species Infraspecific Plant.Name.Index Taxonomic.status
1 Helianthus      annuus                           TRUE         Accepted
2     Silene     acaulis                           TRUE         Accepted
3    Mimulus     alpinus                           TRUE         Accepted
4      Phlox  drummondii                           TRUE         Accepted
5  Triteleia hyacinthina                           TRUE         Accepted
           Family  New.Genus New.Species New.Infraspecific       Authority
1      Compositae Helianthus      annuus                                L.
2 Caryophyllaceae     Silene     acaulis                        (L.) Jacq.
3      Phrymaceae    Mimulus     alpinus              <NA> (A. Gray) Piper
4   Polemoniaceae      Phlox  drummondii                             Hook.
5    Asparagaceae  Triteleia hyacinthina                   (Lindl.) Greene
   Typo WFormat
1 FALSE   FALSE
2 FALSE   FALSE
3 FALSE   FALSE
4 FALSE   FALSE
5 FALSE   FALSE

(df2_corr <- tpl_search(as.character(df2$species), corr = TRUE))

       Genus      Species Infraspecific Plant.Name.Index Taxonomic.status
1 Helianthus       annuus       texanus             TRUE          Synonym
2  Cucubalus      acaulis                           TRUE          Synonym
3    Mimulus langsdorffii       alpinus             TRUE          Synonym
4    Armeria   drummondii                           TRUE          Synonym
5  Triteleia  hyocinthina                           TRUE         Accepted
           Family  New.Genus New.Species New.Infraspecific       Authority
1      Compositae Helianthus      annuus                                L.
2 Caryophyllaceae     Silene     acaulis                        (L.) Jacq.
3      Phrymaceae    Mimulus     alpinus              <NA> (A. Gray) Piper
4   Polemoniaceae      Phlox  drummondii                             Hook.
5    Asparagaceae  Triteleia hyacinthina                   (Lindl.) Greene
   Typo WFormat
1 FALSE   FALSE
2 FALSE   FALSE
3 FALSE   FALSE
4 FALSE   FALSE
5  TRUE   FALSE
It looks like 4 of the 5 names in df2 are synonyms, while 1 name was misspelled. Let’s get the new names for df2 into df2.
df2$newsp <- apply(df2_corr[c("New.Genus", "New.Species")], 1, paste, collapse = " ")
df2 <- df2[, -1]
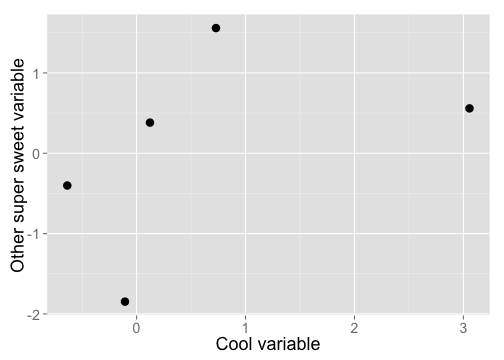
Merge tables and make a plot
(alldat <- merge(df1, df2, by.x="species", by.y="newsp"))

                species    var1    var2    var3    var4
1     Helianthus annuus  0.7285 -0.4922  1.2547  1.5582
2       Mimulus alpinus  0.1223 -0.2955 -0.7310  0.3817
3      Phlox drummondii -0.1071 -0.6371 -0.8728 -1.8467
4        Silene acaulis -0.6368  0.1510  0.1917 -0.4014
5 Triteleia hyacinthina  3.0563  2.3601  2.1583  0.5587

library("ggplot2")
ggplot(alldat, aes(var1, var4)) +
  theme_grey(base_size=18) +
  geom_point() +
  labs(x="Cool variable", y="Other super sweet variable")
And that’s it. Of course in practice your tables will be larger to much larger, but the same concept applies - it will just take longer.
