Specimen records across cities
rOpenSci package: rgbif
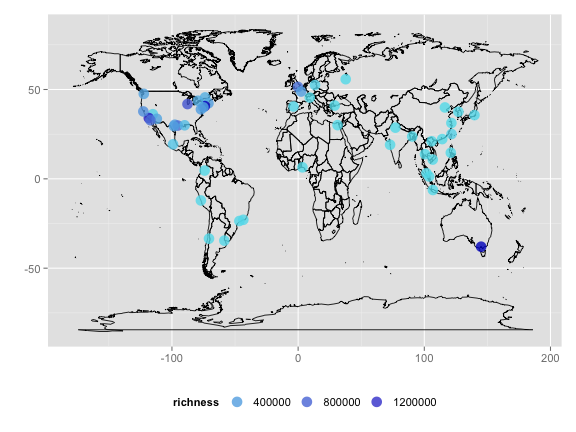
Specimen records across cities
In this example, we collect specimen records across different cities
using GBIF data from the rgbif package.
This example can be done using BISON data as well with our rbison package.
Load libraries
library("rgbif")
library("ggplot2")
library("plyr")
library("RCurl")
library("RColorBrewer")
Get bounding boxes for some cites
rawdat <- getURL("https://raw.githubusercontent.com/amyxzhang/boundingbox-cities/master/boundbox.txt")
dat <- read.table(text = rawdat, header = FALSE, sep = "\t", col.names = c("city",
    "minlat", "maxlon", "maxlat", "minlon"))
dat <- data.frame(city = dat$city, minlon = dat$minlon, minlat = dat$minlat,
    maxlon = dat$maxlon, maxlat = dat$maxlat)
getdata <- function(x) {
    coords <- as.numeric(x[c("minlon", "minlat", "maxlon", "maxlat")])
    num <- occ_search(geometry = coords)$meta$count
    data.frame(city = x["city"], richness = num, stringsAsFactors = FALSE)
}
out <- apply(dat, 1, getdata)
Merge to original table
out <- merge(dat, ldply(out), by = "city")
Add centroids from bounding boxes
out <- transform(out, lat = (minlat + maxlat)/2, lon = (minlon + maxlon)/2)
Plot data
mapp <- map_data("world")
ggplot(mapp, aes(long, lat)) + geom_polygon(aes(group = group), fill = "white",
    alpha = 0, color = "black", size = 0.4) + geom_point(data = out, aes(lon,
    lat, color = richness), size = 5, alpha = 0.8) + scale_color_continuous(low = "#60E1EE",
    high = "#0404C8") + labs(x = "", y = "") + theme_grey(base_size = 14) +
    theme(legend.position = "bottom", legend.key = element_blank()) + guides(color = guide_legend(keywidth = 2))
Notes
Bounding lat/long data from here
