neotoma tutorial
for v1.7.0
The neotoma package is a programmatic R interface to the Neotoma Paleoecological Database. The package is intended to both allow users to search for sites and to download data for use in analyical workflows of paleoecological research.
For more information on the package please refer to:
Goring, S., Dawson, A., Simpson, G. L., Ram, K., Graham, R. W., Grimm, E. C., & Williams, J. W.. (2015). neotoma: A Programmatic Interface to the Neotoma Paleoecological Database. Open Quaternary, 1(1), Art. 2. DOI: 10.5334/oq.ab
Installation
install.packages("neotoma")
Or development version from GitHub
install.packages("devtools")
devtools::install_github("ropensci/neotoma")
library("neotoma")
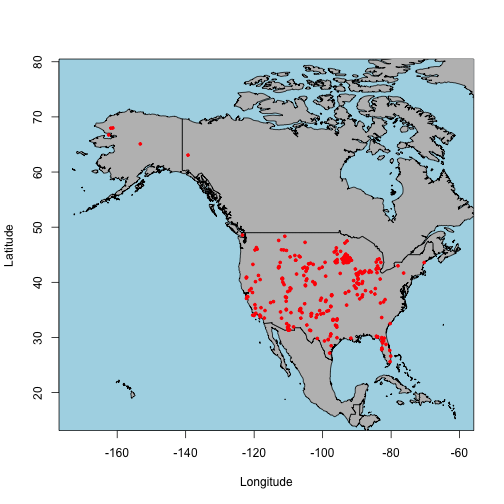
Distribution of sites with Mammoth fossils in Neotoma
Example requires the mapdata package:
library('mapdata')
You may use either ‘%’ or “*” as wildcards for search terms:
test <- get_dataset(taxonname='Mammuthus*')
The API call was successful, you have returned 3273 records.
site.locs <- get_site(test)
A crude way of making the oceans blue.
plot(1, type = 'n',
     xlim=range(site.locs$long)+c(-10, 10),
     ylim=range(site.locs$lat)+c(-10, 10),
     xlab='Longitude', ylab = 'Latitude')
rect(par("usr")[1],par("usr")[3],par("usr")[2],par("usr")[4],col = "lightblue")
map('world',
    interior=TRUE,
    fill=TRUE,
    col='gray',
    xlim=range(site.locs$long)+c(-10, 10),
    ylim=range(site.locs$lat)+c(-10, 10),
    add=TRUE)
points(site.locs$long, site.locs$lat, pch=19, cex=0.5, col='red')
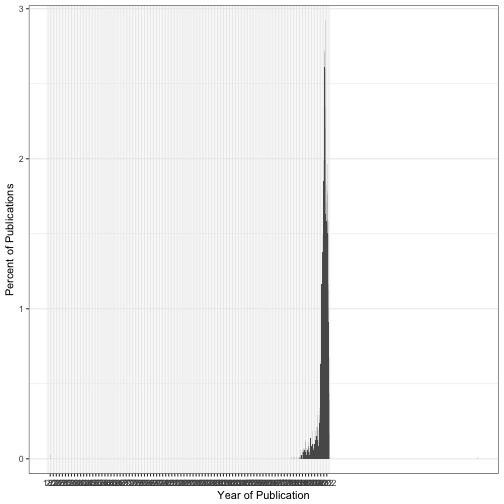
Proportion of publications/year for Neotoma datasets
library('ggplot2')
library('plyr')
pubs <- get_publication()
#> The API call was successful, you have returned  7178 records.
pub.years <- ldply(pubs, "[[", "meta")
ggplot(pub.years, aes(x = year)) +
     stat_bin(aes(y = ..density..*100, position = 'dodge'), binwidth = 1) +
     theme_bw() +
     ylab('Percent of Publications') +
     xlab('Year of Publication') +
     scale_y_continuous(expand = c(0, 0.1)) +
     scale_x_continuous(
       breaks = seq(min(pub.years$year, na.rm = TRUE), 2014, by = 20))
Citing
To cite neotoma in publications use:
Goring, S., Dawson, A., Simpson, G. L., Ram, K., Graham, R. W., Grimm, E. C., & Williams, J. W.. (2015). neotoma: A Programmatic Interface to the Neotoma Paleoecological Database, 1(1), Art. 2. DOI: https://doi.org/10.5334/oq.ab
License and bugs
- License: MIT
- Report bugs at our Github repo for neotoma
